Friday, December 19, 2008
12/19 - DOLLAR REBOUNDS
The US Dollar Index finally found traction at the 78 handle, near a key fibonacci retracement level (61.8% of 71.31-88.19). Extreme oversold daily studies helped end a brutal third wave and underpin a counter-rally towards the 81 handle, approximately a 1/3 retrace. Once this corrective move (fourth wave) is complete, the fifth and final wave should target obvious support at 76.00. Expect near-term weakness while trading below the 20-day MA.
Strategy Summary: BUY AT 1.3764, TARGET 1.4144 1ST, STOP AT 1.3709
Thursday, December 18, 2008
12/18 - EUR/USD'S RECORD GAINS
While I predicted a shift in momentum with the US Dollar by correctly identifying a Head & Shoulders topping pattern, I have been caught off-guard by the size and speed of the latest reversal.
The primary beneficiary has been the EUR/USD, registering it's largest one, two, and five-day gains. From a technical analyst's point-of-view, the latest move in the Euro has blown out all the chart readings and has what we call "gone parabolic."
The primary reason for this due to a fundamental shift. The Federal Reserve has lowered rates to historical levels and embarked on a path of quantitative easing. Meanwhile, the ECB has reminded the market of its reluctance to reduce rates further. This has enabled currency speculators to pour into Euro's, according to open interest and volume indicators provided by the Chicago Mercantile Exchange over the past few days.
So what now? Well, the EUR/USD is now in what is called a blow-off trend. A fast moving trend that is characterized by ascending trendlines. As of this writing, the third ascending trendline has now been breached. A sustained loss of 1.4460 temporarily relieves selling pressure (vs the USD) and according to my (Elliot) wave count, should set-up a consolidation pattern ahead of the next move within the current trend.
Wednesday, December 17, 2008
12/17 - SOLD EUR/USD AT MARKET
The US Dollar Index weakened further on the back of the suprising and desperate measures taken by the Federal Reserve. This triggered a move below the 50% retracement of the entire 2008 recovery to briefly probe a fibonacci retracement (78.6% of 75.89-88.46) this morning. Extreme oversold daily studies should buoy a corrective fourth wave towards the 81 handle, where a cluster of retracement levels lie. Due to alternation this fourth wave should be complex since the second wave (or B wave at that point) was a simple pattern. The fifth and final wave targets previous support at 76.00. Expect selling pressure to persist while below the 10-day MA.
Strategy Summary: SOLD EUR/USD SHORT AT 1.4388 FOR A 1.3928 (CORRECTION TARGET), STOP AT 1.4444
Tuesday, December 16, 2008
12/16 - PROBING POSSIBLE TRENDLINE SUPPORT
The US Dollar's continued weakness is now probing possible trendline support off the July & September lows, just above the 100-day MA. Oversold daily studies could buoy a temporary correction towards 82.13-83.20. Expect weakness to persist, however, while price-action remains below the 10-day & 20-day SMA's.
Strategy Summary: RE-BUY EUR/USD
Monday, December 15, 2008
12/15 - USD WEAKNESS CONTINUES
Last week the US Dollar Index completed an A-B-C correction, highlighting a Head & Shoulders top. CFTC COT (Commitment of Traders) data confirmed a substantial reduction in speculative long Dollar positions and judging by daily increases in FX future volume and open interest, big speculators are piling into the Euro. Today's continued weakness is nearing the 100-day MA, but should be temporarily supported by 82.13, where a key 50% retracement level and a 1.618 equality projection lie. Expect weakness towards the 81 handle (H&S projection) while price-action remains below the 10-day & 20-day SMA.
Strategy Summary: RE-BUY EUR/USD AT 1.3370 FOR 1.3868 (TGT), STOP AT (1.3312)
Thursday, December 11, 2008
12/11 - LONG EUR/USD POSITION MEETS TARGET
The US Dollar Index has completed an A-B-C correction to highlight a Head & Shoulders top. Expect weakness to persist while below the 10-day SMA (now @ 86.10).
Strategy Summary: LONG EUR/USD FROM 1.2607, 1/2 STOPPED AT 1.2552 (-55 pips), 1/2 MET TARGET AT 1.3211 (+604 pips), FOR A TOTAL AVG GAIN OF 274.5 pips
LOOK TO RE-BUY EUR/USD
Strategy Summary: LONG EUR/USD FROM 1.2607, 1/2 STOPPED AT 1.2552 (-55 pips), 1/2 MET TARGET AT 1.3211 (+604 pips), FOR A TOTAL AVG GAIN OF 274.5 pips
LOOK TO RE-BUY EUR/USD
Wednesday, December 10, 2008
12/10 - LONG EUR/USD POSITION ADJUSTED
The US Dollar Index is once again probing 35-day EMA support. A sustained loss of latter immediately exposes the 85 handle, below which will confirm Wave C of the A-B-C correction. Wave A's equality target projects a move towards 84.00 and will highlight a Head & Shoulders top. Expect weakness to persist while below the 10-day SMA (now @ 86.40).
Strategy Summary: LONG EUR/USD from 1.2607 FOR 1.3211 (TARGET), STOP AT 1.2777
Tuesday, December 9, 2008
12/9 - 35-DAY EMA HALTS WEAKNESS
The US Dollar Index again found support at the 35-day EMA, halting recent weakness and more importantly delaying the ongoing A-B-C correction pattern. A loss of 35-day EMA support re-opens the 85 handle, below which will confirm Wave C. Expect dollar weakness while below 87.25 (the trendline connecting the Nov 21st & Dec 4th).
Strategy Summary: LONG EUR/USD from 1.2607 FOR 1.3112 (1st TARGET), STOP AT 1.2707
Monday, December 8, 2008
12/8 - WAVE B COMPLETED
USDX: Wave B is now complete. Below 85.00 confirms the A-B-C Correction pattern and targets 84.00 (equality projection). This also will highlight a Head & Shoulders top, if completed suggests significant weakness ahead. Clearing the trendline connecting the Nov 21st & Dec 4th could trigger a fresh phase of strength towards the 92 handle (long-term pivot).
Strategy Summary: LONG EUR/USD from 1.2607 FOR 1.3112 (1st TARGET), STOP AT 1.2707
Thursday, December 4, 2008
12/4 - LONG POSITION ADJUSTED
The US Dollar Index has potentially completed wave B within an A-B-C correction. Below the 85 handle confirms this corrective formation and will also highlight a head & shoulders distribution pattern. Wave C is now projected to reach 84.00 (roughly 1.31 EUR/USD). Expect dollar weakness to persist while trading below the key fibonacci retracement level (78.6% of 2005 high - 2008 low) near 88.00.
Strategy Summary: LONG EUR/USD AT 1.2607 FOR 1.3112 (ADJUSTED TARGET), 1/2 STOPPED AT 1.2552, ADJUSTED STOP AT 1.2607
Monday, December 1, 2008
12/1 - LONG EUR/USD POSITION FILLED
Strategy Summary: LONG EUR/USD AT 1.2607 FOR 1.3285 (1st TARGET), STOP AT 1.2552
Friday, November 28, 2008
11/28 - LOOK TO BUY EUR/USD
The US Dollar Index is probing the 50% retracement of the false-break correction and the key 20-day SMA. This is potentially viewed as wave B within an A-B-C correction that targets the previous impulse's fourth wave base near the 83 handle. Typically wave B retraces 61.8% before beginning the symmetrical C wave. A sustained clearance of the 87.05 will negate and re-open the key fibonacci retracement level (78.6% of 2005 high - 2008 low) near 88.00.
Strategy Summary: BUY EUR/USD AT 1.2607 FOR 1.3285 1st TARGET, STOP AT 1.2552
Thursday, November 13, 2008
11/13 - US DOLLAR'S FALSE-BREAK?
The Dollar index has once again attained new highs after breaking out of a triangle consolidation pattern earlier this week (thanks to the British Pound) while the key component, namely the EUR/USD has not reached new lows. The DXY is looking at a possible false-break pattern and would confirm with a close below today's opening level of 87.560 (ie reversal day). Spot Crude Oil looks like a possible reversal day as well. If these pan out, it could be a positive for the overall market as these have proven to be leading indicators. Below 20-day MA support would signal a shift in momentum and would suggest that the fifth and final wave from the July lows was a "truncated fifth." The ensuing A-B-C correction will target the base of the fourth wave/triangle pattern which is near the 83 handle.
Strategy Summary: LOOK TO BUY EUR/USD
Thursday, November 6, 2008
11/6 - WAVE D COMPLETED IN TRIANGLE PATTERN
The US Dollar Index has completed three obvious waves (2 impulses and 1 corrective) since bottoming in July and is currently consolidating within the fourth (corrective) wave. Both the Dollar Index and EUR/USD are near completion of wave D within an unfolding triangle pattern. In Elliot wave analysis, triangles are usually evident in the fourth wave of a motive structure and usually are completed when wave E terminates. If this holds true, the dollar should break-out to the upside towards 91.00 (triangle projection) and complete the fifth and final wave. Only a loss of 20-day MA support shifts momentum to the downside.
Strategy Summary: LOOK TO RE-SELL EUR/USD
Wednesday, November 5, 2008
11/5 - TOOK PROFIT ON SHORT EUR/USD POSITION
Tuesday, November 4, 2008
11/4 - SHORT EUR/USD POSITION ADJUSTED
Wednesday, October 29, 2008
10/29 - SHORT EUR/USD POSITION ADJUSTED
US DOLLAR INDEX: The US Dollar surged to a fresh 2-year high against a basket of currencies on Tuesday before finding resistance at a key fibonacci retracement (78.6%) of the decline from the 2005 high to the 2008 low. A very distinguishable distribution pattern (Head & Shoulders) materialized while the EUR/USD was forming a double bottom. Together with over-extended daily readings, a reversal probed through the 10-day moving average for both the EUR/USD and US Dollar Index. Expect dollar strength while the 20-day moving average remains in-tact.
Strategy Summary: SHORT EUR/USD AT 1.4152 FOR 1.2445 (3rd TGT) ADJUSTED STOP at 1.3315
Friday, October 17, 2008
10/19 - SHORT EUR/USD (ADJUSTED STOP & TGT)
Wednesday, October 1, 2008
10/1 - SHORT EUR/USD INITIATED
The EUR/USD is probing key long-term trend-line support in the 1.39-1.40 region. Although, there is a strong possibility of an immediate loss, it is possible that a large triange is forming (currently in wave B). Also note that the Usd/Chf is flirting to break major long-term trend-line resistance. Expect bearishness towards the EUR/USD while trading below the 10 & 20-day MA's.
Strategy Summary: SHORT EUR/USD AT 1.4152 FOR A 1.3900 1st TGT, STOP at 1.4296
Tuesday, September 30, 2008
9/30 - LONG EUR/USD POSITION MEETS 2nd TGT [+724 PIPS] LOOK TO SELL EUR/USD
US DOLLAR INDEX: The 50-day moving average has supported the US Dollar's move back towards the 80 handle. This is in large part due to the aggressive weakness of the Euro. It was the clear loser today and could threaten major trend-line support near 1.40.
Strategy Summary: LONG EUR/USD POSITION MEET 2nd TARGET [+724 PIPS]
SELL EUR/USD AT 1.4152 FOR A 1.3900 1st TGT, STOP at 1.4296
Friday, September 19, 2008
9/19 - LONG EURO, ADJUSTED TARGET & STOP
US DOLLAR INDEX: The US Dollar Index has fallen on it's back foot after briefly probing above the psychologically important 80 handle. After suffering the initial blow due to the Lehman Brother's bankrupcy, subsequent counter-rallies have capped at the 10-day MA indicating a possible deeper retreat for the US Dollar that next targets the 38.2% retracement at 76.86 (roughly 1.4685 EUR/USD).
Strategy Summary: LONG EUR/USD at 1.3923, NEXT TARGET AT 1.4685, STOP AT 1.4205
Thursday, September 11, 2008
9/11 - SELL USD (BUY EUR/USD)
US DOLLAR INDEX:
The US Dollar has edged above the key 80 handle and is now probing 80.42 (December 2004 swing low) . We believe this important pivot will hold and recommend selling the Greenback at current levels. While, negative divergence on several daily studies hint at a short-term dollar top, the major components of the Dollar Index have each found temporary solace. A 6-year bull trend-line at 1.39 should limit EUR/USD downside, the GBP/USD & AUD/USD are both being supported by key retracement levels, and the USD/JPY is threating to lose it's 100-day moving average support. Moreover, the GBP/USD and EUR/USD are both trading within a falling wedge (bullish).
Strategy Summary: LONG EUR/USD at 1.3923, 1st TARGET AT 1.4205, STOP AT 1.3873
Wednesday, September 3, 2008
9/03 - Inching towards key fibonacci retracement levels
US DOLLAR INDEX:
The US Dollar has extended through the December 2007 peak and is now inching towards a key fibonacci retracement at 79.05 (38.2% of 2005 high to 2008 low). Meanwhile, the EUR/USD, which failed to maintain a recovery above the 10 & 14-day MA's, has broken below it's key long-term trend-line at 1.4580 (connecting 2005 & Aug 2007 lows) and is also nearing a key 38.2% retracement. We remain dollar bulls (euro bears) while trading above a cluster of moving averages (10, 14, & 20) .
Tuesday, August 26, 2008
8/26 - SHORT POSITION PROFIT TAKEN [+106 PIPS]
US DOLLAR INDEX:
The US Dollar managed to rebound off long-term (internal) trend-line support (connecting Nov 2005 & Aug 2007 peaks) to probe the 400-day moving average for the first time in over two years. To put things in perspective, the Dollar Index has still only retraced a third of its losses since 2005, only half of the overall bear move. More importantly, the EUR/USD, which failed to maintain a recovery above the 10 & 14-day MA's, is being supported by key long-term trend-line at 1.4580 (connecting 2005 & Aug 2007 lows). Our short position met the initial target, then the remaining half was trailed down to the 10-day MA and subsequently stopped for profit. If the EUR/USD can sustain a rally above the 10 & 14-day MA's (mid 1.47's), this would mark an overdue correction vs the US dollar.
Strategy Summary:
SHORT EUR/USD at 1.4805, 1/2 OFF AT 1st TARGET AT 1.4665 (+140 pips)
1/2 STOPPED FOR PROFT AT 1.4733 (+72 pips)
Friday, August 22, 2008
Thursday, August 21, 2008
8/21 - SELL EUR/USD AT 1.4965 OR 1.4805
US DOLLAR INDEX:
After setting a fresh 2008 high, the US Dollar Index has fallen back to a long-term internal trend-line at 76.03. Falling interest rates and a rebound in commodity prices have contributed to the Dollar's correction. This comes as no suprise, as the EUR/USD, which completed it's double-top objective at 1.4665, has now double bottomed and is currently back above it's 10-day MA near 1.48. Moreover, the USD/CHF & USD/JPY both failed to maintain key psychological levels (1.10/110), which led to USD/JPY to lose key support at 109.50 overnight. We remain cautiously optimistic with the US Dollar and will look to sell the EUR/USD at 1.4965 (former range top), where price-action is projected to meet the key 20-day MA. If long-term internal trend-line support with the US Dollar Index holds, then we recommend selling the EUR/USD on a break below the 10-day MA.
Strategy Summary:
SELL LIMIT EUR/USD at 1.4965, STOP LOSS at 1.5015, 1st TARGET 1.4665
SELL STOP EUR/USD at 1.4805, STOP LOSS at 1.4855, 1st TARGET 1.4665
Wednesday, August 20, 2008
8/20 - LOOK TO BUY USD (SELL EUR/USD)
US DOLLAR INDEX:
The US Dollar Index briefly probed the 77.35-85 region (December and January peaks) to set a fresh 2008 high. More importantly, the EUR/USD has completed it's double top objective (1.4670) and managed to recover to the 10-day MA (1.4803) after double-bottoming in the mid 1.46 region. Extreme oversold readings and negative hourly diverging studies, along with falling treasury yields and a rebound in commodity prices, all contributed to profit-taking in the US Dollar. We maintain our bullish bias towards the Greenback while above long-term internal trend-line support near 76.00 and if the USD/CHF & USD/JPY can maintain key psychological levels (1.10/110).
The US Dollar Index Strategy Summary: LOOK TO BUY USD (SELL EUR/USD)
Friday, August 15, 2008
8/15 - SELL USD (BUY EUR/USD)
US DOLLAR INDEX:
The US Dollar has exploded higher, marking the first time in years to substantially close above the 200-day MA. The pace, which has been extraordinary, is now showing signs of slowing with several hourly indicators demonstrating negative divergence. We recommend selling USD's in the 77.35-85 region, (December and January peaks) for a move back to the 10-day MA. This also would correlate with EUR/USD's projected double top objective (near 1.46) and is also where the 400-day MA lies. Moreover, with treasury yields falling and commodity prices showing some signs of a temporary base, these forces should cause the US Dollar to correct downward before resuming it's strength.
The US Dollar Index Strategy Summary: LOOK TO SELL USD (BUY EUR/USD)
Sunday, August 10, 2008
8/10 - BUY USD (SELL EUR/USD)
US DOLLAR INDEX: Races through 200-day resistance
The US Dollar Index has surged through the 200-day moving average to probe key trend-line resistance. Early morning Friday saw the USD/CHF break through its 200-day MA and the Euro and Pound lose key support, underpinning the USD's first time above the 200-day MA in 20 months. Most of the US Dollar Index's success is attributed to the Euro's demise. A loss of key support confirmed a major distribution pattern, namely a double top, providing a price objective near 1.46. Moreover, the EUR/JPY lost key 50-day support and is now threating its 100-day MA. While the EUR/USD is now in capitulation mode, caution is advised as daily studies are registering extreme oversold readings.
Strategy Summary: LOOK TO BUY USD (SELL EUR/USD)
Tuesday, August 5, 2008
Thursday, July 31, 2008
7/31 - USD & EUR/USD POSITIONS STOPPED FOR PROFIT
Wednesday, July 30, 2008
7/30 - LONG USD POSITION EYES FIRST TARGET
Tuesday, July 29, 2008
7/29 - SHORT EUR/USD POSITION MEETS 1ST TARGET
Monday, July 28, 2008
7/28 - LONG USD (EUR/USD SHORT) TARGETS ADJUSTED
US Dollar Index – Hovering between pivot and 100-day MA
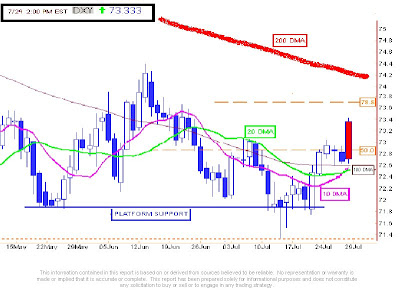
The US Dollar Index is once again probing a 50% retracement level (72.85). The last time was the beginning of July when the 20-day MA halted the USD’s advance, eventually leading to a capitulation that has since based. More importantly, Thursday’s high of 73.02 is near the July rejection and at the exact same point where the April recovery struggled at before moving higher. These two rallies also have the same base points (71.31) and the same rally points (71.86). This implies that above 73.02 projects a test of 73.71 first (78.6% retracement & pivot resistance). We recommend buying the US dollar while price-action remains above the 100-day MA (72.56) for an extension towards 74.22 (June high & 200-day MA). Only below 71.86 (platform base) shifts momentum back to the downside.
Strategy Summary: LONG USDX AT 72.56 FOR 73.71 (1st TARGET), 74.22 (2nd TARGET), STOP AT 72.34….……….……………
SHORT EUR/USD AT 1.5740 FOR 1.5580 (1st TARGET), 1.5400 (2nd TARGET) STOP AT 1.5785
Friday, July 25, 2008
7/25 - LONG USD (SHORT EUR/USD)
The US Dollar Index has probed 72.85 (50% retracement level) since Wednesday. Overbought studies contributed to today’s pullback to the 100-day moving average (72.55) and while sustaining 72.40 (last Friday’s swing high), implies an impulsive wave structure as opposed to a mere A-B-C correction. Moreover, the April recovery started at the same point (71.31) and struggled with similar resistance (73.02). A similar rejection in early July suggests that clearing 73.02 will open 73.71 first (78.6% retracement & pivot resistance), then expose the 200-day MA (74.28). Losing the 20-day MA (72.41) questions the validity of this advance and below 71.86 (platform support) shifts focus back to the downside
Strategy Summary:
LONG USDX AT 72.56 FOR 73.71 (1st TARGET), 74.28 (2nd TARGET), STOP AT 72.34….……….…………… SHORT EUR/USD AT 1.5740 FOR 1.5580 (1st TARGET), 1.5400 (2nd TARGET) STOP AT 1.5785……..………………..
Thursday, July 24, 2008
7/24 - ADJUST BUY USD (SELL EUR/USD) ENTRIES
The US Dollar Index surged through 10-day MA resistance on Tuesday, extending yesterday through the 100-day MA to currently probe 72.85 (50% retracement level). Last week’s capitulation completed a five wave structure and has since put in an A-B-C correction. While above 72.40 (also where 20-MA currently sits) suggests an impulsive wave structure that could ultimately test the 200-day MA (currently at 74.30). While short-term studies remain overbought, we recommend buying the US Dollar on dips, with a stop-loss below the 20-day MA.
Strategy Summary: BUY USDX AT 72.56 FOR 74.35 (TARGET), STOP AT 72.34….………………….…….……………
SELL EUR/USD AT 1.5740 FOR 1.5580 (TARGET), STOP AT 1.5785…
.
Wednesday, July 23, 2008
7/23 - BUY USD ON A PULLBACK (SELL EUR/USD)
After three days being stuck below the 10-day MA at 72.19, the US Dollar Index has raced through to probe the 100-day MA at 72.57. Maintaining platform support at 71.86 hinted at a base, price-action in relation to the 10-day MA is what ultimately shifted momentum. Clearing the 100-day MA, immediately focuses 72.85 (50% retracement), then the 200-day MA (currently at 74.33). We recommend buying the US Dollar on a pullback to the 20-day MA with a stop-loss below the 10-day MA.
Strategy Summary:
Strategy Summary:
BUY USDX AT 72.36 FOR 74.35 (TARGET), STOP AT 72.14….………………….……
SELL EUR/USD AT 1.5810 FOR 1.5666 (TARGET), STOP AT 1.5865
Tuesday, July 22, 2008
7/22 - LONG EUR/USD MEETS TARGET, BUY USD
The US Dollar Index reversed last week and is now above the 10-day moving average at 72.18, which had capped price-action the previous three days. Platform support at 71.86 held up earlier, underpinning the EUR/USD below its 20-day MA support at 1.5817 and the USD/JPY above its 200-day MA (currently at 107.09). The US Dollar Index is now poised to eclipse the 100-day moving average at 72.58 and target the 200-day MA at 74.35. We now recommend buying the US Dollar on a pullback to the 10-day MA with a stop-loss below platform support.
Strategy Summary: SHORT USDX FROM 72.40 MET 71.86 TARGET, BUY AT 72.18 FOR 74.35, STOP AT 71.84
LONG EUR/USD FROM 1.5816 MET 1.5932 TGT, SELL@ 1.5825 FOR 1.5666, STOP@ 1.5878
Monday, July 21, 2008
7/21 - SHORT USD, LONG EUR/USD MEETS 1ST TARGET
The US Dollar Index reached 71.31 last Tuesday, matching a daily pivot from March & April, ahead of Wednesday’s reversal day. This also completed a five wave count and has led to the third straight day in which the 10-day moving average has been under pressure. Current consolidation between the 10-day MA (currently at 72.27) and platform support at 71.86 should precede the next breakout. While we continue to recommend shorting the US Dollar, if the EUR/USD loses its 20-day MA support (currently at 1.5806) and if the USD/JPY can reclaim and maintain the 200-day MA (currently at 107.14), this will thrust the US Dollar Index through a cluster of moving averages (10, 20, 100-day MA’s) and shift momentum towards the 200-day MA at 74.38. If however, platform support is lost at 71.86, then 71.31 is likely to be re-tested.
Strategy Summary: SHORT USDX AT 72.40 FOR 71.86 (1st TGT) 71.50 (2nd TGT), STOP AT 72.45 (REVISED)
LONG EUR/USD FROM 1.5816 TOOK ½ OFF AT 1.5890, 1.5932 (TARGET), STOP AT 1.5806 (REVISED)
Friday, July 18, 2008
7/18 - SHORT USD, LONG EUR/USD
The US Dollar Index spiked below 71.86 (May trough) reaching 71.31 (daily pivot) on Tuesday. Wednesday’s reversal day ended a series of intra-day lower high’s and since clearing former channel support at 72.14, the 10-day average has been probed (currently at 72.32). We continue to recommend shorting the US Dollar while trading below the 10-day for a possible re-test of 71.31, if platform support at 71.86 is lost. If the EUR/USD loses its 20-day support (currently at 1.5798) and if the USD/JPY can reclaim the 200-day (currently at 107.11), this will thrust the US Dollar Index through a cluster of moving averages (10, 20, 100-day) and shift momentum towards the 200-day moving 74.44
Strategy Summary: SHORT USDX AT 72.40 FOR 71.86 (1st TGT) 71.50 (2nd TGT), STOP AT 72.40 (REVISED)
LONG EUR/USD FROM 1.5816 FOR 1.5890 (1st TGT) 1.5932 (2nd TGT), STOP AT 1.5772 (REVISED)
Thursday, July 17, 2008
7/17 - SIGNS OF A USD BOTTOM, SELL INTO RALLIES
The US Dollar Index lost 10-day support last week, underpinning a spike lower that rejected at 71.31 (daily pivot). Although, bull channel support has been lost, the fact that price-action has held up around 71.86 (May trough) highlights possible platform support. Wednesday’s reversal day ended of a series of intra-day lower top’s, suggesting a move to 72.35/45 (10-day moving average/ 38.2% retracement) if former channel support turned resistance at 72.14 is broken. We continue to recommend shorting the US Dollar while trading below the 10-day & 20-day moving averages. An early clue to a possible shift in our strategy will be whether the EUR/USD can maintain 10-day support (currently at 1.5827) and if the USD/JPY can reclaim the 50-day (currently at 105.80). Other factors to watch will be whether the GBP/USD can maintain 2.00 and it’s 200-day (currently at 1.9960) and if the USD/CAD can maintain support near parity and the 200-day (currently at .9992).
Strategy Summary: SELL USDX AT 72.40 FOR 71.314 (TARGET), STOP AT 72.65
LONG EUR/USD FROM 1.5816 FOR 1.5932 (REVISED TARGET), STOP AT 1.5777 (REVISED STOP)
Wednesday, July 16, 2008
7/16- SELL USD AT 72.40, BUY EUR/USD AT 1.5816
The US Dollar Index lost 10-day support last week, underpinning the latest spike downward. A rejection at the 71.31 daily pivot (Spring ‘08 lows), buoyed a recovery back to the latest swing low just above 72.00. More importantly, today’s price-action has ended a trend of intra-day lower top’s and now is expected to test the 72.40 zone that occupies the 10 & 20-day moving average, and the 38.2% retracement. We continue to recommend shorting the US Dollar Index at the 10-day moving average with a tight stop above the 20-day moving average.
Strategy Summary: SELL USDX AT 72.40 FOR 70.50, STOP AT 72.65 LONG EUR/USD AT 1.5816 FOR 1.6148 (TARGET), STOP AT 1.5772
Tuesday, July 15, 2008
7/15 - MISSED USD SELL, LOOK TO SELL
The US Dollar Index rejected at a key midpoint and the 20-day moving average last week, underpinning an initial move back to the 10-day moving average. After being compressed between the two moving averages for several days, support was lost, leading to the latest capitulation. Previous moves have shown symmetry in regards to their length (2.5 points). If this holds, then a move to 70.50 is projected, marginally below the all-time low. We recommend shorting the US Dollar Index at the 10-day moving average with a tight stop above the 20-day moving average.
Strategy Summary: MISSED SELL USDX , SELL AT 72.25 FOR 70.50, STOP AT 72.65
MISSED BUY EUR/USD, BUY AT 1.5845 FOR 1.6148 (TARGET), STOP AT 1.5805
Friday, July 11, 2008
7/11 - SHORT USD POSITION MEETS TARGET, RE-SELL USD
The US Dollar’s oversold rebound rejected at a key midpoint and the 20-day moving average, underpinning a move back to the 10-day moving average. For several days, price-action was compressed between the two moving averages, until yesterday. The 10-day moving average (now at 72.50) which had provided support over the past few days, reverted to resistance today and has led to a probe below channel support (at 72.11) and a re-test of the May trough (at 71.86). This has confirmed a lower top, but due to oversold conditions, we anticipate consolidation before moving any further down. However, a failure to reclaim the 10-day moving average suggests a capitulation style move towards the March lows.
Strategy Summary : SHORT USDX POSITION MET TARGET, SELL AT 72.40 FOR 71.50, STOP AT 72.66 BUY EUR/USD AT 1.5833 FOR 1.6048 (1st TARGET), STOP AT 1.5781
Thursday, July 10, 2008
7/10 - POSITIONS STOPPED OUT, SELL USD
The US Dollar Index’s oversold recovery has struggled with the 20-day moving average, highlighting the failure to reclaim the upper portion of a multi-month bull channel. Also, the 10-day moving average (now @ 72.57), which had provided support since rebounding, has been breached with the latest retreat. A sustained loss will damage the dollar’s outlook and re-expose last week’s lows near 72.00. We recommend a short position (buying eur/usd) with a stop-loss above the 20-day moving average (72.94).
Strategy Summary : LONG USDX POSITION STOPPED OUT, SELL AT 72.60 FOR 72.06, STOP AT 72.94
SHORT EUR/USD POSITION STOPPED OUT, BUY AT 1.5727 FOR 1.5872, STOP AT 1.5687
Tuesday, July 8, 2008
7/8 – LONG USD (SHORT EUR/USD)
The US Dollar Index is now probing the half-way mark of an amended bull channel. The 10-day moving average (now @72.58), which provided resistance in late June, is now supporting. The previous 3 rebounds amounted to 2.5 point up moves, a similar sized move would project a test of channel resistance @74.50.
Strategy Summary : LONG USDX AT 72.60 FOR 74.50 (NEW TARGET), REVISED STOP AT 72.53
SHORT EUR/USD AT 1.5727 FOR 1.5355 (NEW TARGET), REVISED STOP AT 1.5746
Strategy Summary : LONG USDX AT 72.60 FOR 74.50 (NEW TARGET), REVISED STOP AT 72.53
SHORT EUR/USD AT 1.5727 FOR 1.5355 (NEW TARGET), REVISED STOP AT 1.5746
Subscribe to:
Posts (Atom)